Data Viewer
Type key: data_viewer_node
Group: Utilities
Category: utility
Tier: CORE
The Data Viewer node is a pure passthrough inspection node. It forwards all incoming data to its output unchanged, while rendering the data payload in the Voodflow canvas UI for real-time debugging and development. It has zero side effects on workflow execution.
Handles
| Handle | Direction | Description |
|---|---|---|
input | Input | Any data array |
output | Output | Identical data array, unmodified |
Configuration
| Field | Type | Default | Description |
|---|---|---|---|
view_mode | enum | auto | How to render the data in the UI: auto, json, table |
View Modes
auto (default)
The engine inspects the data shape and selects the most appropriate view:
- If the root value is an array of objects with consistent keys →
table - Otherwise →
json
json
Renders the full data payload as a formatted, syntax-highlighted JSON tree. Supports collapsing nested objects and arrays. Best for exploring deeply nested or irregular data structures.
table
Renders the data as a tabular grid. Each top-level array item becomes a row; keys become column headers. Ideal when the data is a flat list of records (e.g. query results from Data Model).
Passthrough Behavior
The node executes as follows:
public function execute(ExecutionContext $context): ExecutionResult
{
    return ExecutionResult::success($context->input);
}
It returns exactly what it receives. Placing it in the middle of a workflow has no effect on execution outcome or data shape.
Use Cases
Data Viewer showing aggregated sales report
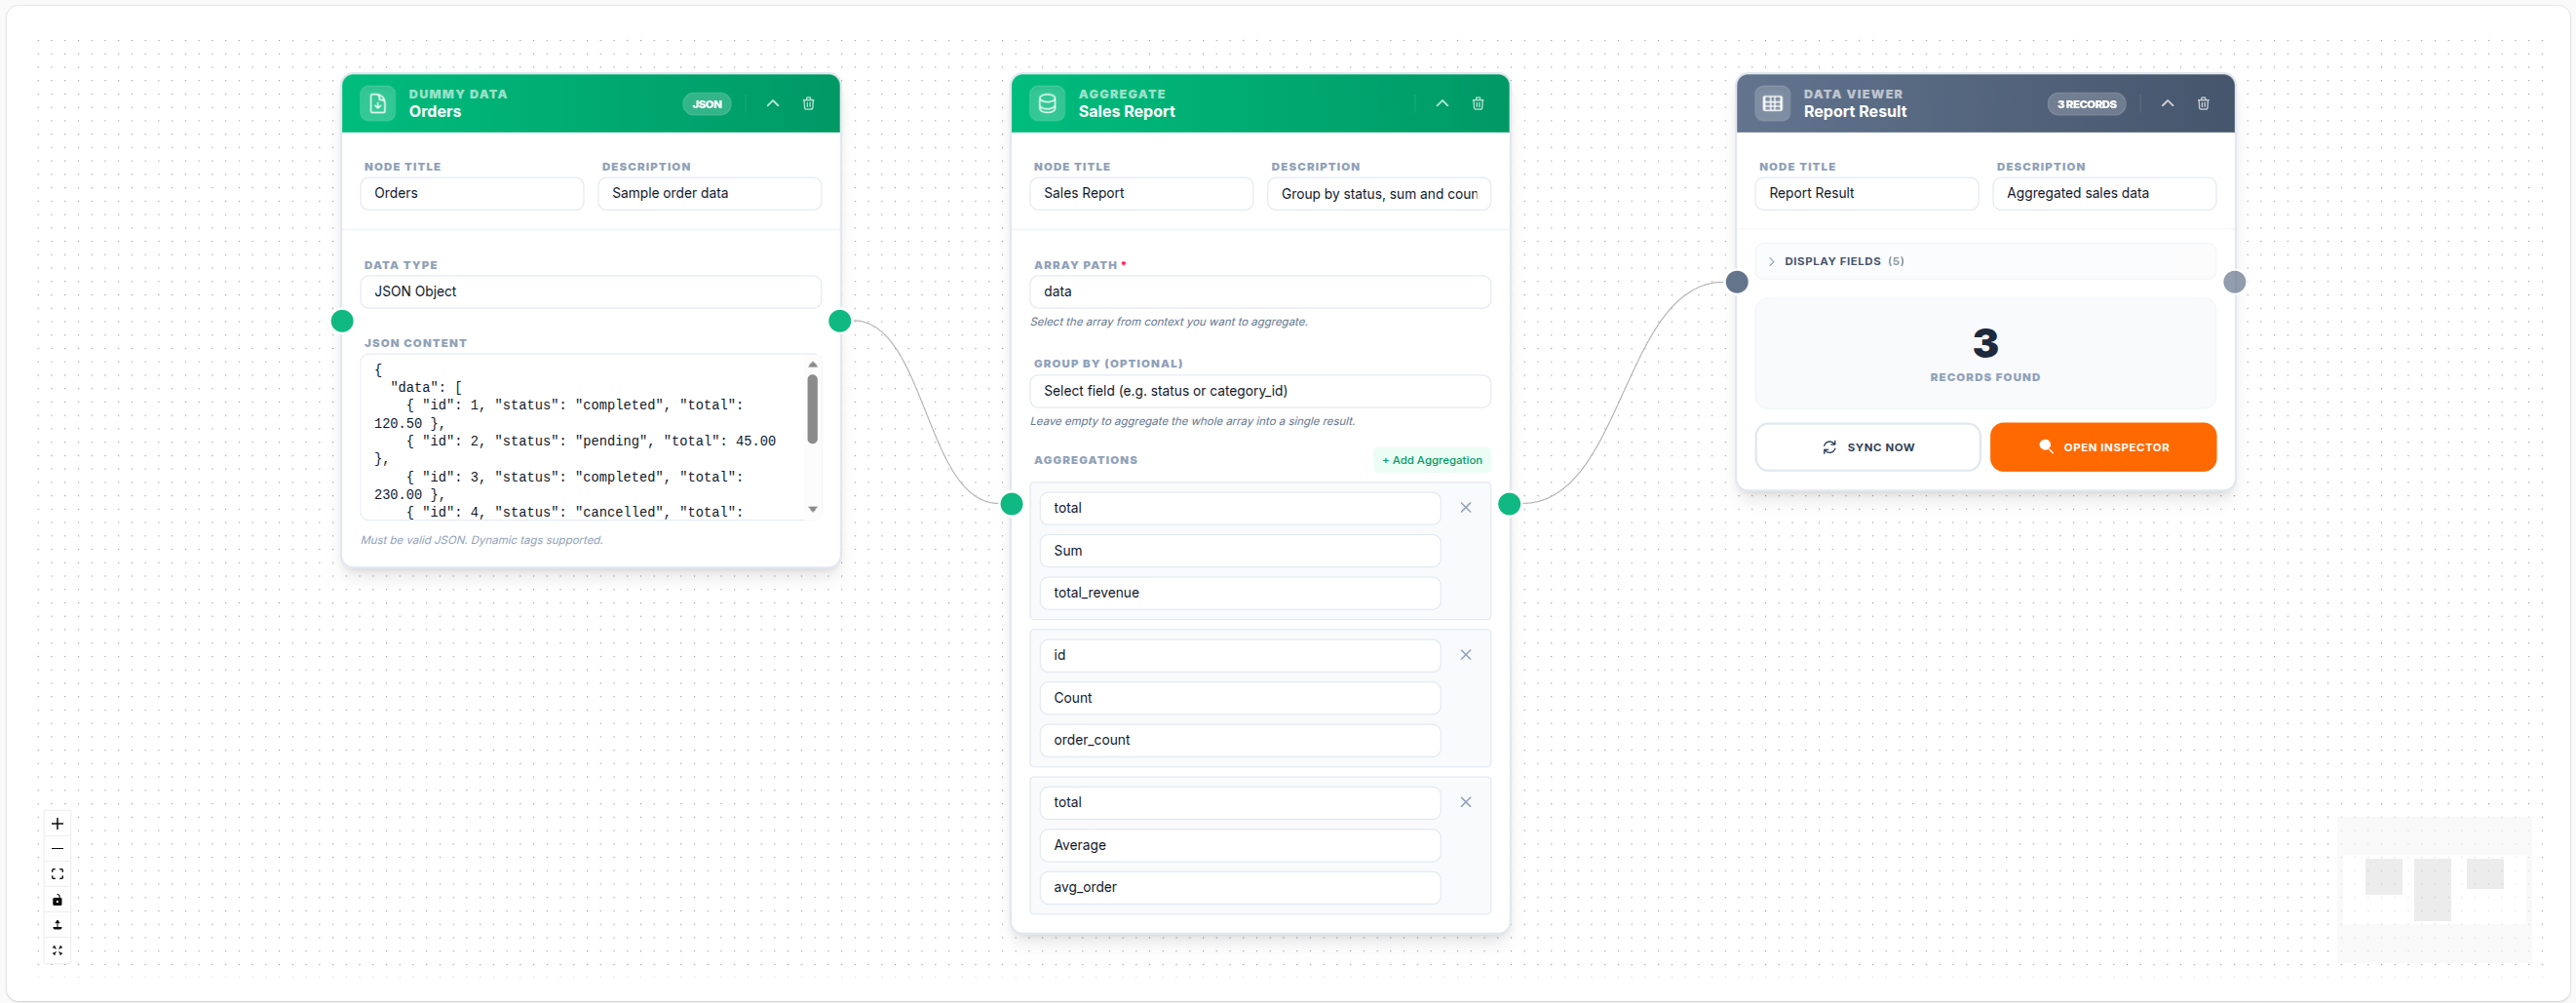
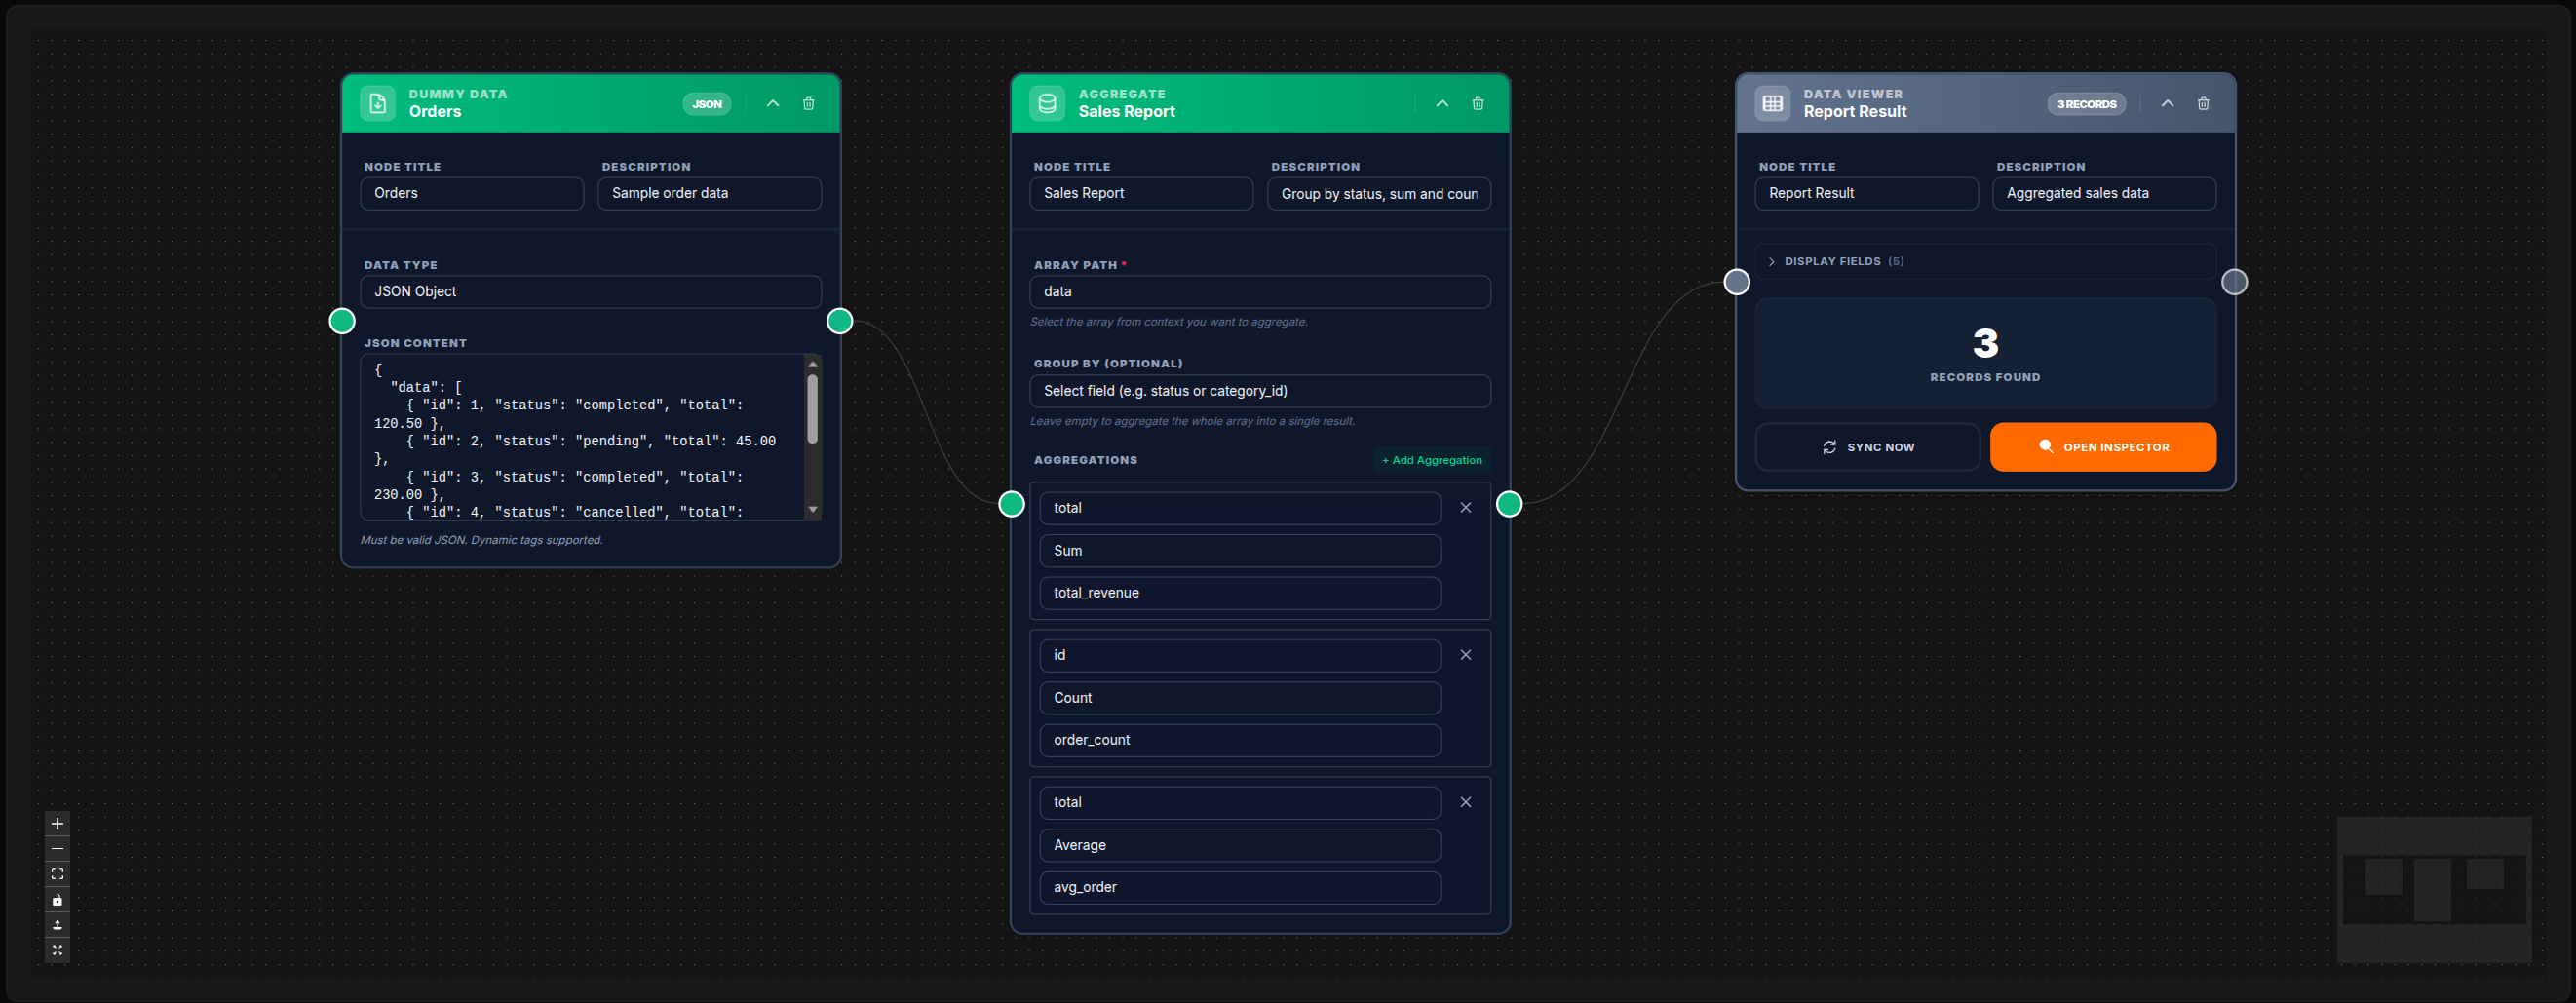
💾 Try this example
Download the workflow JSON — open an empty workflow and import the file.
Data Viewer on If node branches
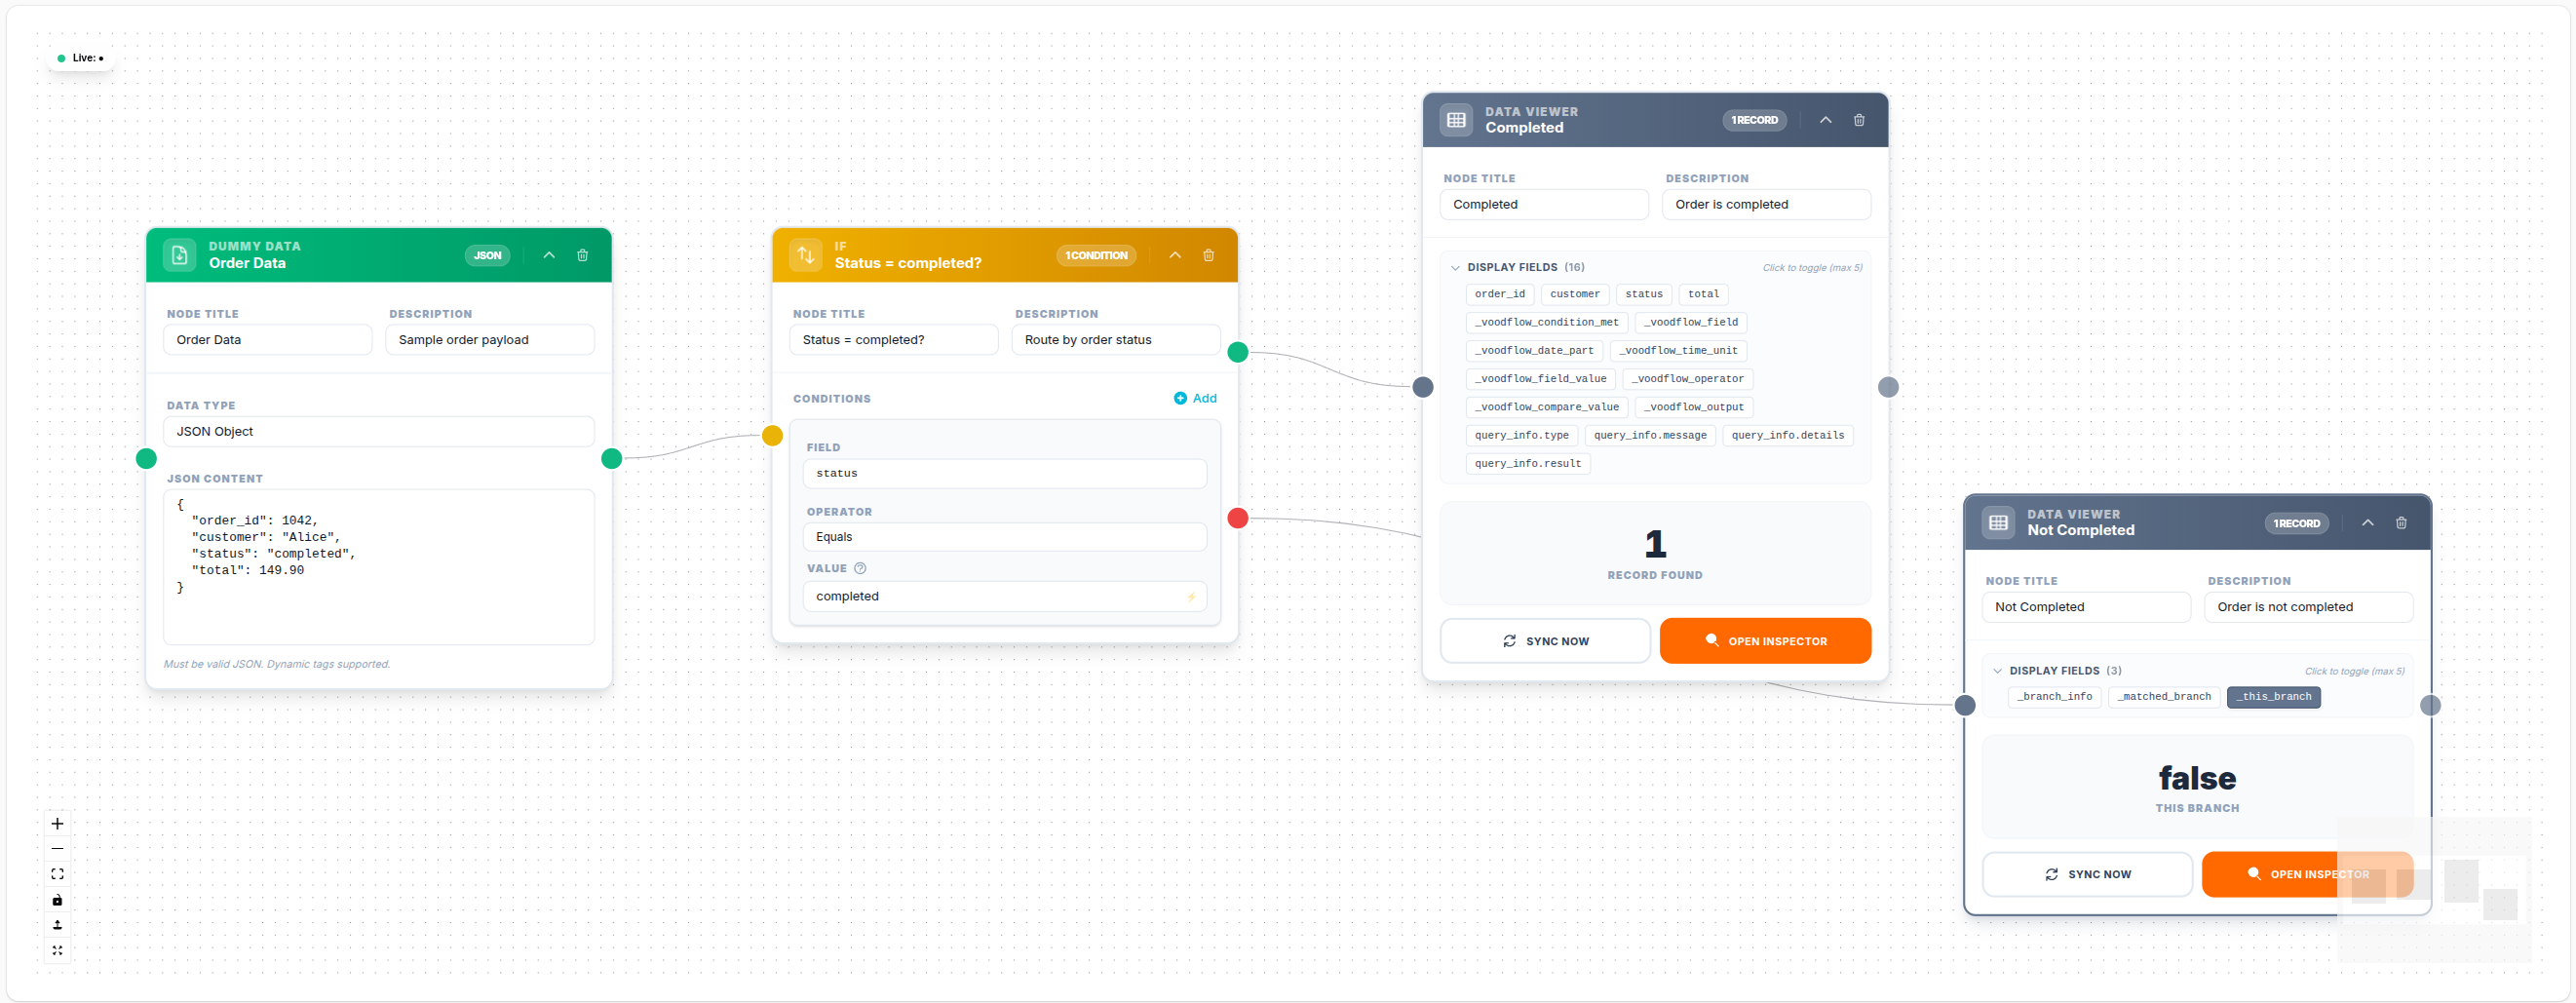
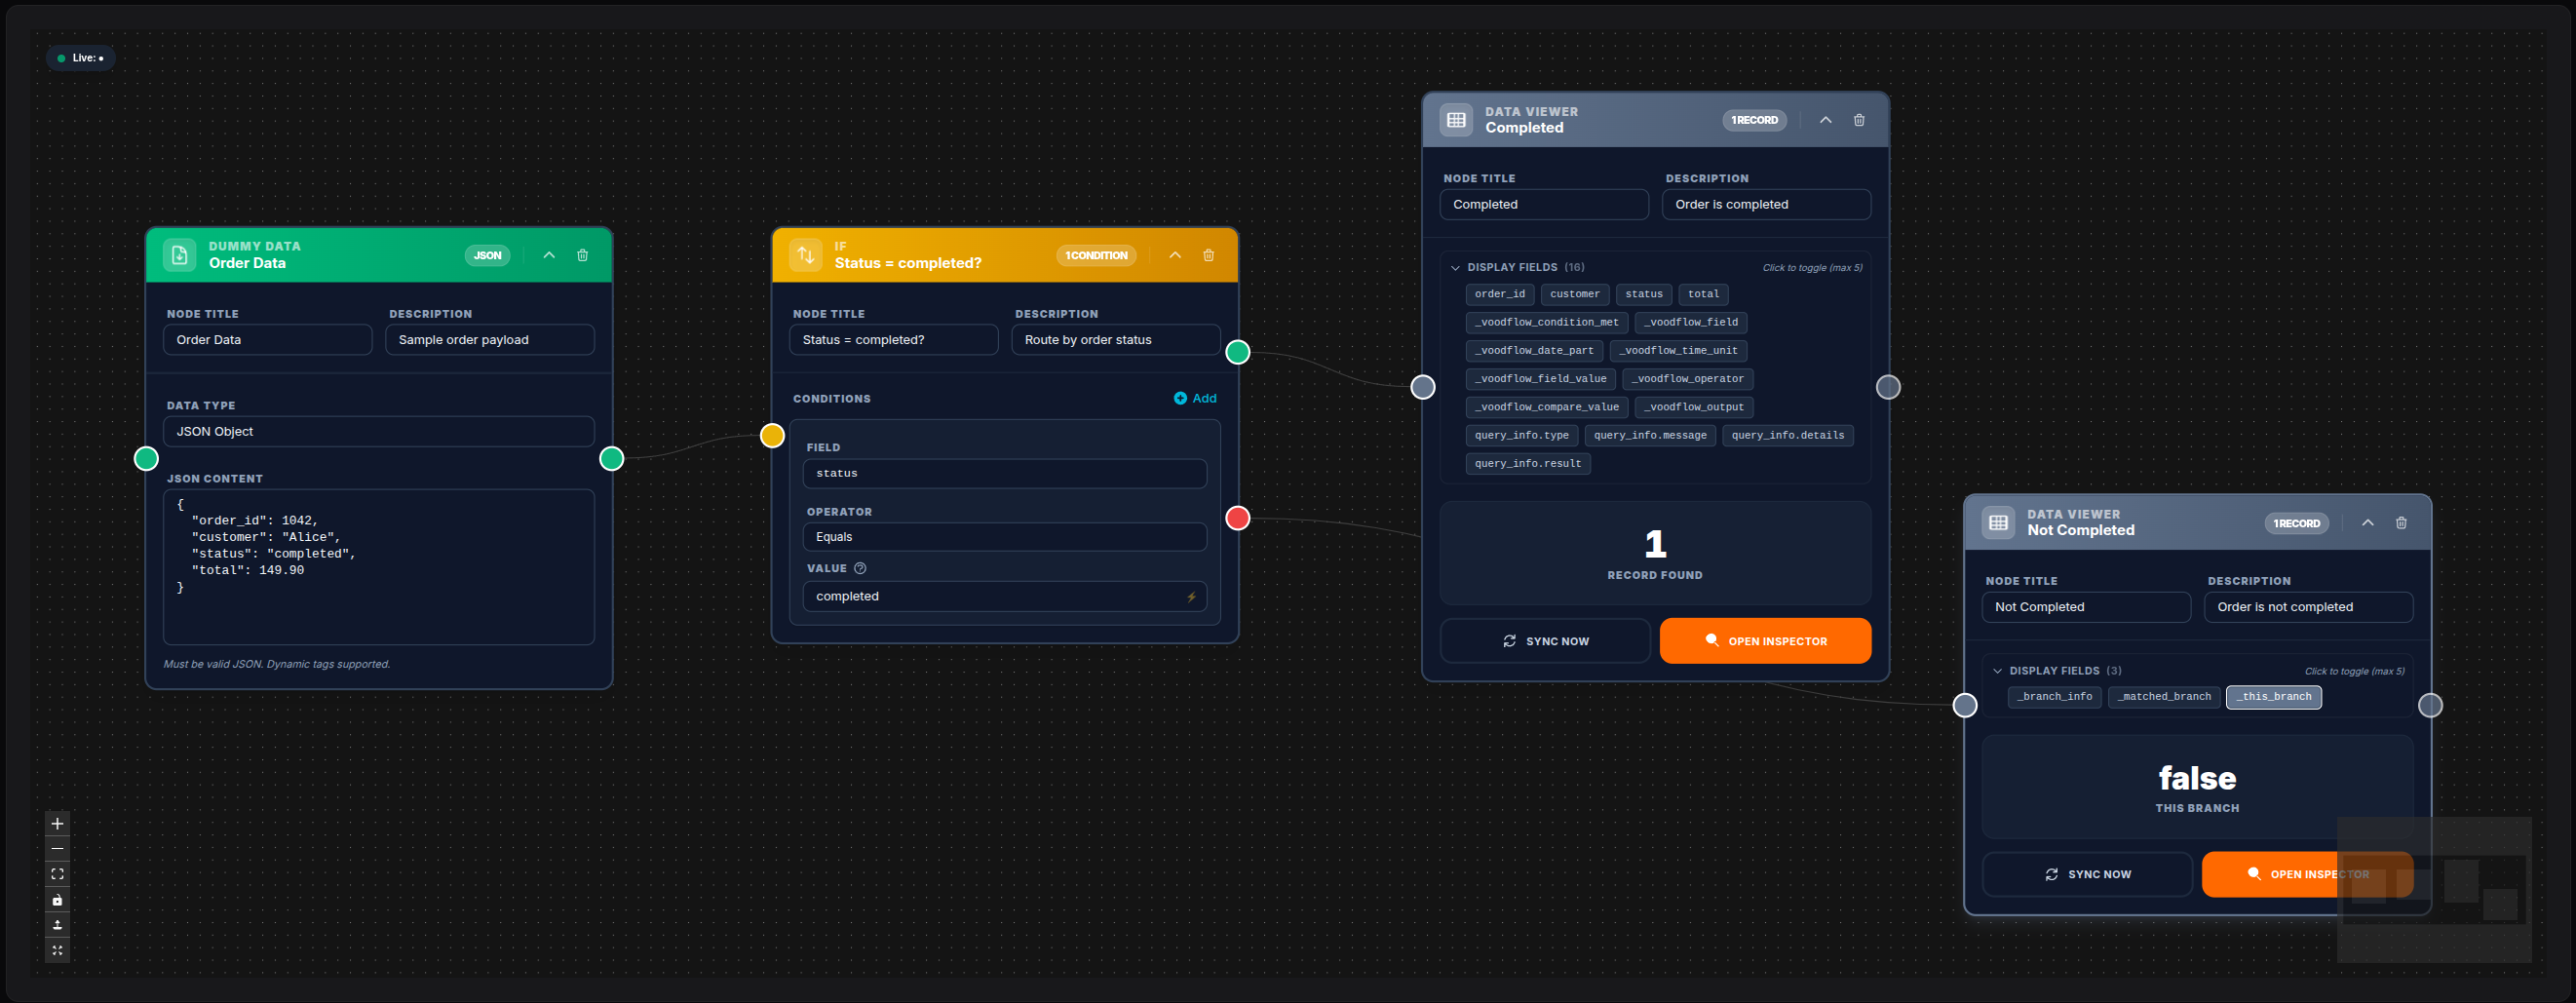
💾 Try this example
Download the workflow JSON — open an empty workflow and import the file.
1. Debugging an Intermediate Step
Insert Data Viewer between two nodes to inspect what the upstream node is producing without disrupting the pipeline:
Data Model
     │
     ▼
Data Viewer   ◄── inspect here
     │
     ▼
Transform
2. Verifying Template Resolution
After a Transform or Expression node, attach a Data Viewer to confirm the expected fields are present and correctly computed before sending them to an external API.
3. Development / Staging Only
During development, sprinkle Data Viewer nodes throughout a workflow to trace data at each stage. Before deploying to production, remove them or bypass them — since they are pure passthrough, they can also be safely left in place with no performance cost.
4. Execution Log Inspection
The data rendered in the UI also appears in the per-node execution log. Reviewing past executions in the Executions panel shows the snapshot of data at the Data Viewer node at the time of that specific run.
UI Rendering
In the Voodflow canvas, the Data Viewer node displays:
- A live preview panel that shows the last execution's output data
- Toggle controls to switch between JSON / table views at runtime
- Column sorting and filtering in table mode
- JSON search and expand/collapse in JSON mode
The UI preview is populated from the execution record. It requires at least one successful workflow run after the node was added.
Performance
The Data Viewer adds negligible overhead: it performs a single array copy and a JSON encode for the UI snapshot stored in the execution record. It is safe to leave in production workflows.
Notes
- The Data Viewer is the recommended first tool when a downstream node produces unexpected output; it removes the need for
dd()or log statements - Unlike
dd(), it does not halt execution — it passthrough continues the pipeline - Use PHP Code if you need to log custom messages or inspect context-level variables beyond the input payload
- The
view_modesetting affects only the UI rendering, never the data itself